Archive for the 'Mozilla' Category

Don’t Use Mozilla Persona to Secure High-Value Data

Tuesday, February 11th, 2014

Mozilla Persona (formerly called Browser ID) is a login system that Mozilla has developed to make it better for users to sign in at sites without having to remember passwords. But I have seen a trend recently of people within Mozilla insisting that we should use Persona for all logins. This is a mistake: the security properties of Persona are simply not good enough to secure high-value data such as the Mozilla security bug database, user crash dumps, or other high-value information.

The chain of trust in Persona has several attack points:

The Public Key: HTTPS Fetch

When the user submits a login “assertion”, the website (Relying Party or RP) fetches the public key of the email provider (Identity Provider or IdP) using HTTPS. For instance, when I log in as benjamin@smedbergs.us, the site I’m logging into will fetch https://smedbergs.us/.well-known/browserid. This relies on the public key and CA infrastructure of the internet. Attacking this part of the chain is hard because it’s the network connection between two servers. This doesn’t appear to be a significant risk factor to me except for perhaps some state actors.

The Public Key: Attacking the IdP HTTPS Server

Attacking the email provider’s web server, on the other hand, becomes a very high value proposition. If an attacker can replace the .well-known/browserid file on a major email provider (gmail, yahoo, etc) they have the ability to impersonate every user of that service. This puts a huge responsibility on email providers to monitor and secure their HTTPS site, which may not typically be part of their email system at all. It is likely that this kind of intrusion will cause signin problems across multiple users and will be detected, but there is no guarantee that individual users will be aware of the compromise of their accounts.

Signing: Accessing the IdP Signing System

Persona email providers can silently impersonate any of their users just by the nature of the protocol. This opens the door to silent identity attacks by anyone who can access the private key of the identity/email provider. This can either be subverting the signing server, or by using legal means such as subpoenas or national security letters. In these cases, the account compromise is almost completely undetectable by either the user or the RP.

What About Password-Reset Emails?

One common defense of Persona is that email providers already have access to users account via password-reset emails. This is partly true, but it ignores an essential property of these emails: when a password is reset, a user will be aware of the attack then next time they try to login. Being unable to login will likely trigger a cautious user to review the details of their account or ask for an audit. Attacks against the IdP, on the other hand, are silent and are not as likely to trigger alarm bells.

Who Should Use Persona?

Persona is a great system for the multitude of lower-value accounts people keep on the internet. Persona is the perfect solution for the Mozilla Status Board. I wish the UI were better and built into the browser: the current UI that requires JS, shim libraries, and popup windows; it is not a great experience. But the tradeoff for not having to store and handle passwords on the server is worth that small amount of pain.

For any site with high-value data, Persona is not a good choice. On bugzilla.mozilla.org, we disabled password reset emails for users with access to security bugs. This decision indicates that persona should also be considered an unacceptable security risk for these users. Persona as a protocol doesn’t have the right security properties.

It would be very interesting to combine Persona with some other authentication system such as client certificates or a two-factor system. This would allow most users to use the simple login system, while providing extra security properties when users start to access high-value resources.

In the meantime, Mozilla should be careful how it promotes and uses Persona; it’s not a universal solution and we should be careful not to bill it as one.

Mozilla Summit: Listen Hard

Tuesday, October 1st, 2013

Listen hard at the Mozilla Summit.

When you’re at a session, give the speaker your attention. If you are like me and get distracted easily by all the people, take notes using a real pen and paper. Practice active listening: don’t argue with the speaker in your head, or start phrasing the perfect rebuttal. If a speaker or topic is not interesting to you, leave and find a different session.

At meals, sit with at least some people you don’t know. Introduce yourself! Talk to people about themselves, about the project, about their personal history. If you are a shy person, ask somebody you already know to make introductions. If you are a connector who knows lots of people, one of your primary jobs at the summit should be making introductions.

In the evenings and downtime, spend time working through the things you heard. If a presentation gave you a new technique, spend time thinking about how you could use it, and what the potential downsides are. If you learned new information, go back through your old assumptions and priorities and question whether they are still correct. If you have questions, track down the speaker and ask them in person. Questions that come the next day are one of the most valuable forms of feedback for a speaker (note: try to avoid presentations on the last day of a conference).

Talk when you have something valuable to ask or say. If you are the expert on a topic, it is your duty to lead a conversation even if you are naturally a shy person. If you aren’t the expert, use discretion so you don’t disrupt a conversation.

If you disagree with somebody, say so! Usually it’s better to disagree in a private conversation, not in a public Q&A session. If you don’t know the history of a decision, ask! Be willing to change your mind, but also be willing to stay in disagreement. You can build trust and respect even in disagreement.

If somebody disagrees with you, try to avoid being defensive (it’s hard!). Keep sharing context and asking questions. If you’re not sure whether the people you’re talking to know the history of a decision, ask them! Don’t be afraid to repeat information over and over again if the people you’re talking to haven’t heard it before.

Don’t read your email. Unfortunately you’ll probably have to scan your email for summit-related announcements, but in general your email can wait.

I’ve been at two summits, a mozcamp, and numerous all-hands and workweeks. They are exhausting and draining events for introverted individuals such as myself. But they are also motivating, inspiring, and in general awesome. Put on a positive attitude and make the most of every part of the event.

More great summit tips from Laura Forrest.

Click-To-Play Plugin Telemetry

Friday, September 13th, 2013

Last week we finally turned on click-to-play plugins as the default state for all plugins except Flash in Nightly builds (which will be Firefox 26). This is a milestone in giving Firefox users control over plugins and helping protect them from being exploited via unused and unwanted plugins.

As part of this feature, we have started to measure how users interact with the click-to-play UI. Nightly users aren’t typical, so this data probably doesn’t mean much yet, but it’s nice to see it in action:

PLUGINS_NOTIFICATION_PLUGIN_COUNT

This data shows how many different kinds of plugins were present in the plugin notification UI when each user saw it. When designing the notification, we wanted to streamline the common case, which we believed was that normally there would be only one kind of plugin on a page. This telemetry data will help verify our assumption. The current Nightly data shows a single type of plugin is the most common case, but not by as much as I originally thought:

# of Plugins

Notification Count

1

32994

2

5935

3

179

4

3

5 or more

0

PLUGINS_NOTIFICATION_SHOWN

This data shows what user action triggered showing the plugin notification.

User Action

Notification Count

Click on in-content plugin UI

23706

Click on location bar icon

15405

I’m surprised that so many users are clicking on the location bar icon. That may just be inquisitive users checking what each button does, but I’ll be monitoring this as it goes up the trains to the more representative beta population. If this stays very high, then we may have a problem with distracting users with unnecessary UI.

PLUGINS_NOTIFICATION_USER_ACTION

This data shows what action users are choosing to take in the plugin notification. Note that when multiple plugins are shown in the same notification, there will be a separate action for each plugin:

User Action

Notification Count

Allow Now

16705

Allow Always

9196

Block

2199

I’m a little surprised at the distribution of “Allow Now” and “Allow Always”. When designing this UI, we expected that most users would want the “Allow Always” option, and we wanted to highlight that. But again, Nightly users are atypical and may not be a good sample. I’ll be watching this data also in beta.

I’m a wary of drawing any significant conclusions from early data, but I’m happy that we appear to be collecting the correct data and with the new telemetry dashboard it’s not hard to get at simple measurements such as this. Kudos to Taras, Mark Reid, and Chris Lonnen for getting that runing and the small daily improvements that make all our lives better.

Graph of the Day: Virtual and Physical Memory Starvation

Wednesday, April 24th, 2013

Today’s graph is a scatter plot of out-of-memory crashes. It categorizes crashes according to the smallest block of available VM and the amount of available pagefile space.

There were roughly 1000 crashes due to bug 829954 between 10-April and 15-April 2013. Click on individual crash plots to see memory details and a link to the crash report.

Direct link to SVG file. Link to raw data.

Conclusions

After graphing these crashes, it seems clear that there are two distinct issues:

  • Crashes which are above the blue line and to the left have free space in their page file, but we have run out of contiguous virtual memory space. This is likely caused by the virtual memory leak from last week.
  • Crashes which are below the blue line and to the right have available virtual memory, but don’t have any real memory for allocation. It is likely that the computer is already thrashing pretty heavily and appears very slow to the user.

I was surprised to learn that not all of these crashes were caused by the VM leak.

The short-term solution for this issue remains the same: the Mozilla graphics engine should stop using the infallible/aborting allocator for graphics buffers. All large allocations (network and graphics buffers) should use the fallible allocator and take extra effort to be OOM-safe.

Long-term, we need Firefox to be aware of the OS memory situation and continue to work on memory-shrinking behavior when the system starts paging or running out of memory. This includes obvious behaviors like throwing away the in-memory network and graphics caches, but it may also require drastic measures such as throwing away the contents of inactive tabs and reloading them later.

Charting Technique

With this post, I am starting to use a different charting technique. Previously, I was using the Flot JS library to generate graphs. Flot makes pretty graphs (although it doesn’t support labeling Axes without a plugin!). It also features a wide range of plugins which add missing features. But often, it doesn’t do exactly what I want and I’ve had to dig deep into its guts to get things to look good. It is also cumbersome to include dynamically generated JS graphs in a blog post, and the prior graphs have been screenshots.

This time around, I generated the graph as an SVG image using the svgwrite python library. This allows me to put the full SVG graph directly into the blog, and it also allows me to dynamic features such as rollovers directly in these blog posts. Currently I’m setting up the axes and labels manually in python, but I expect that this will turn into a library pretty quickly. I experimented with svgplotlib but the installation requirements were too complex for my needs.

I’m not sure whether or not the embedded SVG will make it through feed aggregators./readers or not. Leave comments if you see weird results.

Graph of the Day: Empty Minidump Crashes Per User

Monday, April 22nd, 2013

Sometimes I make a graph to confirm a theory. Sometimes it doesn’t work. This is one of those days.

I created this graph in an attempt to analyze bug 837835. In that bug, we are investigating an increase in the number of crash reports we receive which have an empty (0-byte) minidump file. We’re pretty sure that this usually happens because of an out-of-memory condition (or an out of VM space condition).

Robert Kaiser reported in the bug that he suspected two date ranges of causing the number of empty dumps to increase. Those numbers were generated by counting crashes per build date. But they were very noisy, partly because they didn’t account for the differences in user population between nightly builds.

In this graph, I attempt to account for crashes per user. This was a slightly complicated task, because it assembles information from three separate inputs:

  • ADU (Active Daily Users) data is collected by Metrics. After normalizing the data, it is saved into the crash-stats raw_adu table.
  • Build data is pulled into the crash-stats database by using a tool called ftpscraper and saved into the releases_raw table. Anything called “scraper” is finicky and changes to other system can break it.
  • Crash data is collected directly in crash-stats and stored in the reports_clean table.

Unfortunately, each of these systems has their own way of representing build IDs, channel information, and operating systems:

Product

Build ID

Channel

OS

raw_adu

“Firefox”

string “yyyymmddhhmmss”

“nightly”

“Windows”

releases_raw

“firefox”

integer yyyymmddhhmmss

“Nightly”

“win32”

reports_clean

“Firefox” (from product_versions)

integer yyyymmddhhmmss

“Nightly” when selecting from reports_clean.release_channel, but “nightly” when selecting from reports.release_channel.

“Windows NT”, but only when a valid minidump is found: when there is an empty minidump, os_name is actually “Unknown”

In this case, I’m only interested in the Windows data, and we can safely assuming that almost all of the empty minidump crashes occur on Windows. The script/SQL query to collect the data simply limits each data source separately and then combines them after they have been limited to windows nightly builds, users, and crashes.

Frequency of Empty Dump crashes on Windows Nightlies

This missing builds are the result of ftpscraper failure.

I’m not sure what to make of this data. It seems likely that we may have fixed part of the problem in the 2013-01-25-03-10-18 nightly. But I don’t see a distinct regression range within this time frame. Perhaps around 25-December? Of course, it could also be that the dataset is so noisy that we can’t draw any useful conclusions from it.

Graph of the Day: Old Flash Versions and Blocklist Effectiveness

Friday, April 19th, 2013

Today’s graph charts the percentage of Firefox users who have known-insecure versions of Flash. It also allows us to visually see the impact of various plugin blocks that have been staged over the past few months.

We are gradually rolling out blocks for more and more versions of Flash. In order to make sure that the blocklist was not causing significant user pain, we started out with the oldest versions of Flash that have the fewest users. We have since been expanding the block to include more recent versions of Flash that are still insecure. We hope to extend these blocks to all insecure versions of Flash in the next few months.

Flash Insecure Release Distribution

From the data, we see that users on very old versions of Flash (Flash 10.2 and earlier) are not changing their behavior because of the blocklist. This either means that the users never see Flash content, or that they always click through the warning. It is also possible that they attempted to upgrade but for some reason are unable.

Users with slightly newer versions seem more likely to upgrade. Over about a month, almost half of the users who had insecure versions of Flash 10.3-11.2 have upgraded.

Finally, it is interesting that these percentages drop down on the weekends. This indicates that work or school computers are more likely to have insecure versions of Flash than home computers. Because there are well-known exploits for all of these Flash versions, this represents a significant risk to organizations who are not keeping up with security updates!

View the chart in HTML version and the raw data. This data was brought to you by Telemetry, and so the standard cautions apply: telemetry is an opt-in sample on the beta/release channels, and may under-represent certain populations, especially enterprise deployments which may lock telemetry off by default. This data represents Windows users only, because we just recently started collecting Flash version information on Mac, and the Linux Flash player doesn’t expose its version at all.

Raw aggregates for Flash usage can be found in my dated directories on crash-analysis.mozilla.com, for example yesterday’s aggregate counts. You are welcome to scrape this data if you want to play with it; I am also willing to provide interested researchers with additional data dumps on request.

Chart of the Day: Firefox Nightly Update Adoption Curves

Monday, April 15th, 2013

In general, people who are running the Firefox Nightly and Aurora channel are offered a new build every day. But users don’t update immediately, because Firefox does not interrupt you with an update prompt upon receiving an update. Instead it waits and applies the update at the next Firefox restart, or prompts the user to update only after significant idle time.

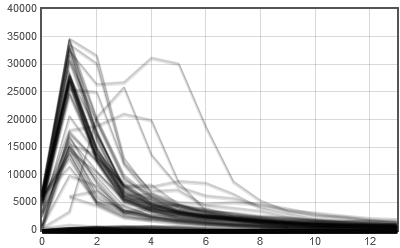
This means that there is a noticeable “delay” between a nightly build and when people start reporting bugs or crashes against the build. It also means that the number of users using any particular nightly build can vary widely. The following charts demonstrate this variability and the update adoption curves:

Per-build usage and adoption curves, Firefox nightly builds on Windows, 1-March to 14-April 2013
Overlapped adoption curves, 1-March to 14-April 2013

Because of this variability, engineers and QA should use care when using data from nightly builds. Note the following conclusions and recommendations:

  • Holidays, weekends, and other unexplained factors may mean that some nightly builds get below-average user totals.
  • Users often skip nightlies: reported regression ranges should be verified.
  • Reliable crash metrics will not be available for several days after a nightly build is released.
  • It may be necessary to correlate crash rates on particular builds against the user counts for that build in order to accurately measure crashes-per-user.
  • When multiple nightlies are built on the same day (for example, a respin for a bad regression), the user count for each build will be lower than an average nightly build.

This data was collected from ADU data provided by metrics and mirrored in the crash-stats database. The script used to collect this data is available in socorro-toolbox.

Graph of the Day: Firefox Virtual Memory Plot

Thursday, April 11th, 2013

I spend a lot of time making sense out of data, and so I’m going to try a new “Graph of the Day” series on this blog.

Today’s plot was created from a crash report submitted by a Firefox user and filed in bugzilla. This user had been experiencing problems where Firefox would, after some time, start drawing black boxes instead of normal content and soon after would crash. Most of the time, his crash report would contain an empty (0-byte) minidump file. In our experience, 0-byte minidumps are usually caused by low-memory conditions causing crashes. But the statistics metadata reported along with the crash show that there was lots of available memory on the system.

This piqued my interest, and fortunately, at least one of the crash reports did contain a valid minidump. Not only did this point us to a Firefox bug where we are aborting when large allocations fail, but it also gave me information about the virtual memory space of the process when it crashed.

When creating a Windows minidump, Firefox calls the MinidumpWriteDump function with the MiniDumpWithFullMemoryInfo flag. This causes the minidump to contain a MINIDUMP_MEMORY_INFO_LIST block, which includes information about every single block of memory pages in the process, the allocation base/size, the free/reserved/committed state, whether the page is private (allocated) memory or some kind of mapped/shared memory, and whether the page is readable/writable/copy-on-write/executable.

(view the plot in a new window).

There are two interesting things that I learned while creating this plot and sharing it on mozilla.dev.platform:

Virtual Memory Fragmentation

Some code is fragmenting the page space with one-page allocations. On Windows, a page is a 4k block, but page space is not allocated in one-page chunks. Instead, the minimum allocation block is 16 pages (64k). So if any code is calling VirtualAlloc with just 4k, it is wasting 16 pages of memory space. Note that this doesn’t waste memory, it only wastes VM space, so it won’t show up on any traditional metrics such as “private bytes”.

Leaking Memory Mappings

Something is leaking memory mappings. Looking at the high end of memory space (bottom of the graphical plot), hover over the large blocks of purple (committed) memory and note that there are many allocations that are roughly identical:

  • Size: 0x880000
  • State: MEM_COMMIT
  • Protection: PAGE_READWRITE PAGE_WRITECOMBINE
  • Type: MEM_MAPPED

Given the other memory statistics from the crash report, it appears that these blocks are actually all mapping the same file or piece of shared memory. And it seems likely that there is a bug somewhere in code which is mapping the same memory repeatedly (with MapViewOfFile) and forgetting to call UnmapViewOfFile when it is done.

Conclusion

We’re still working on diagnosing this problem. The user who originally reported this issue notes that if he switches his laptop to use his integrated graphics card instead of his nvidia graphics, then the problem disappears. So we suspect something in the graphics subsystem, but we’re not sure whether the problem is in Firefox accelerated drawing code, the Windows D3D libraries, or in the nvidia driver itself. We are looking at the possibility of hooking allocations functions such as VirtualAlloc and MapViewOfFile in order to find the call stack at the point of allocation to help determine exactly what code is responsible. If you have any tips or want to follow along, see bug 859955.

Introducing Jydoop: Fast and Sane Map-Reduce

Tuesday, April 9th, 2013

Analyzing large data sets is hard, but it’s often way harder than it needs to be. Today, Taras Glek and I are unveiling a new data-analysis tool called jydoop. Jydoop is designed to allow engineers without any experience in HBase/Hadoop to write data analyses on their local machine and then deploy the analysis to our production Hadoop cluster. We want to enable every Mozilla engineer to use telemetry and crash-stats data as effectively as possible.

Goals

Jydoop started with three simple goals:

Enable fast prototyping/testing

Setting up hadoop/hbase is unreasonably difficult and time-consuming, and engineers should not need a hadoop/hbase setup in order to write an analysis. Because Jydoop analyses are written in Python, they can be developed and tested on a local machine without Hadoop or even Java.

Don’t hide map/reduce

In a query language like pig, it is hard to know exactly how your query will perform; which tasks will run on the map nodes, which will run on the reducers, and which must be run on the final reduced data. Jydoop doesn’t hide those details: each analysis has simple map/combine/reduce functions so that engineers know how a clustered query is going to behave.

Be fast

Performance of clustered queries should be as good or better than our existing solutions using pig or other existing tools.

Prototyping

Telemetry data takes the form of a single blob of JSON which is stored in an hbase table. A telemetry ping may be larger than 100kb, and we typically receive about 2 million telemetry pings per day. In order to allow engineers to test an analysis, we save off a small sample of reports (5000 or so) in a single file. Then analysis scripts can be written and tested against the sample.

The simplest job is one which simply acts as a filter. The following script is used to select all telemetry records which have an “androidANR” key and save them to a file:

import telemetryutils

# Ask telemetryutils to set up our query by date range using the correct hbase tables
setupjob = telemetryutils.setupjob

def map(key, value, context):
    if value.find("androidANR") == -1:
         return

    context.write(key, value)

To test this script against sample data, run python FileDriver.py scripts/anr.py sampledata.txt.
To run this script against a single day of telemetry data, run make ARGS='scripts/anr.py anrresults-20130308.txt 20130308 20130308' hadoop.

More complex analyses are also possible. The following script will calculate the bucketed distribution of the size of the telemetry ping:

import telemetryutils
import jydoop
import json

setupjob = telemetryutils.setupjob

kBucketSize = float(0x400)

def map(key, value, context):
    j = json.loads(value)
    channel = j['info'].get('appUpdateChannel', None)

    # if .info.appUpdateChannel is not present, we don't care about this record
    if channel is None:
        return # Don't care about this record

    bucket = int(round(len(value) / kBucketSize))
    context.write((channel, bucket), 1)

combine = jydoop.sumreducer
reduce = jydoop.sumreducer

I was then able to produce this chart with the result data and a little JS:

telemetry-size-distribution-20130308

History and Alternatives

The native language for Hadoop map/reduce jobs is Java. Writing an analysis directly in Java requires careful construction of a class hierarchy and is extremely tedious. Even more annoying, it’s basically impossible to test an analysis without having access to a hadoop/hbase environment. Even if you use something like the cloudera test VMs, setting up hbase and mapreduce jobs on test data is onerous.

It is a venerable Hadoop tradition to build wrapper tools around mapreduce which run distributed queries. There are tools such as Hadoop Streaming which allow map/reduce to forward to arbitrary programs via pipes. There are at least five different tools which already combine Hadoop with python. Unfortunately, none of these tools met the performance and prototyping requirements for Mozilla’s needs.

At Mozilla, we currently mostly use pig, a query language and execution tool which transforms a series of query and filter statements into one or more map/reduce jobs. In theory, pig has an execution mode which can prototype a query on local data. In practice, this is also very difficult to use, and so most people prototype their pig scripts directly on the production cluster. It works after a while, but it’s not especially friendly.

Performance

They key difference between Jydoop and the existing Python alternatives is that we use Jython to run the python code directly within the map and reduce jobs, rather than shelling out and communicating via pipes. This allows for much tighter integration with hadoop and also allows us to control the execution environment.

For maximum performance, we use a custom key/value class which serializes and compares python objects. For performance and sanity, this class operates on a limited subset of Python types: analysis scripts are limited to using only None, integers, floats, strings, and tuples of these basic types as their key and values.

During the process of developing Jydoop, we also discovered that JSON parsing performance was a significant factor in the overall job speed. The performance of the `json` module which is built into jython 2.7 is horrible. We got better but not great performance using jyson as a drop-in JSON replacement. Eventually we wrote a complete json replacement which wraps the standard Jackson streaming API. With these improvements in place, tt appears that jydoop performance beats pig performance on equivalent tasks.

Conclusion

Jydoop is now available on github.

We hope that jydoop will make it possible for many more people to work with telemetry, crash, and healthreport data. If you have any issues or questions about using jydoop with Mozilla data, please feel free to ask questions in mozilla.dev.platform. If you are using jydoop for other projects, feel free to file github issues, submit github PRs, or email me directly and let me know what you’re up to!

Do You Love Your Debugger?

Thursday, March 7th, 2013

Short version: I’m hiring, apply here!

Do you love your debugger? Are you interested in a job making a better Firefox for millions of people? Making Firefox a rock-solid software program involves being a dedicated puzzle-solver. Figuring out what’s causing a crash, hang, or intermittent performance problem is a combination of data gathering, statistics, debugging, code reading, and proactive coding and debugging features.

Familiarity or even love of debugging is an important part of the job. The set of information in a crash minidump is limited, and frequently the stack trace is garbled. Understanding calling conventions and memory layout of compiled code is an important skill! Being able to read disassembly is essential. Familiarity with debugging across multiple platforms (Windows/Mac/Linux/Android) is going to be important.

The Mozilla crash and telemetry data is a treasure trove of information just waiting for analysis. The servers have some important builtin features for classification and querying, but the stability team frequently needs to slice the data in new ways. Familiarity with data processing using python, SQL, hbase, and elasticsearch is helpful.

Many of our stability issues are caused by third-party software (more than half of our crashes, according to recent statistics). This position will undoubtedly involve working with partners and engineers from other projects and companies to diagnose and fix problems.

Finally, we are always looking for ways to solve entire classes of stability issues. For example, we moved browser plugins into their own process so that even if a plugin crashes, it doesn’t affect the entire browser. We are continuing to reduce the impact of plugin and extension issues by having users opt into these addons. To be effective at these types of projects, an engineer will need to be a productive coder who is comfortable learning new pieces of code quickly, as well as writing in C++ as well as JavaScript.

If you’re interested, apply online, and feel free to contact me directly if you’ve got questions!