Profiling Dromaeo Testcases with Shark
I’m taking a break from garbage collection for a week or so: I got stuck, and there are lots of other things going on I wanted to help out on. Yesterday and today’s project was profiling some DOM testcases.
Two days ago, Jason recently landed a great patch to minimize the XPConnect overhead of DOM calls (fast-path DOM). Prior to this patch, many profiles of DOM scripting were dominated by XPConnect overhead (marshaling calls from JS to binary XPCOM). So I decided to re-do some of these profiles and see if there were any easy wins lurking, now that the noise was gone. I first ran the Dromaeo tests in a build from mozilla-central and compared the results to Safari on the same machine. Now, I’m taking some of the comparatively worst performers and using Shark to profile the tests.
I figured that getting shark to profile individual tests would require some major hacking. But it turns out that Dromaeo already has support for wrapping tests with calls to generate Shark profiles! All I needed to do was hack a little bit to generate a single profile at a time.
I started by profiling the following test: DOM Modification (Prototype): update(). mozilla-central was 8x slower than Safari on this test.
- Start with a shark-enabled Firefox.
- Download or clone Dromaeo from here.
- Type `make web` to build a local copy of Dromaeo.
- Start shark for programmatic control as documented here.
- Point your browser at the test like so:
file:///builds/dromaeo/web/index.html?dom-modify-prototype&shark=update&numTests=1
- Shark should do a little dance and pop up a profile viewer. For a quick overview on using the Shark profile viewer, see Vlad’s blog.
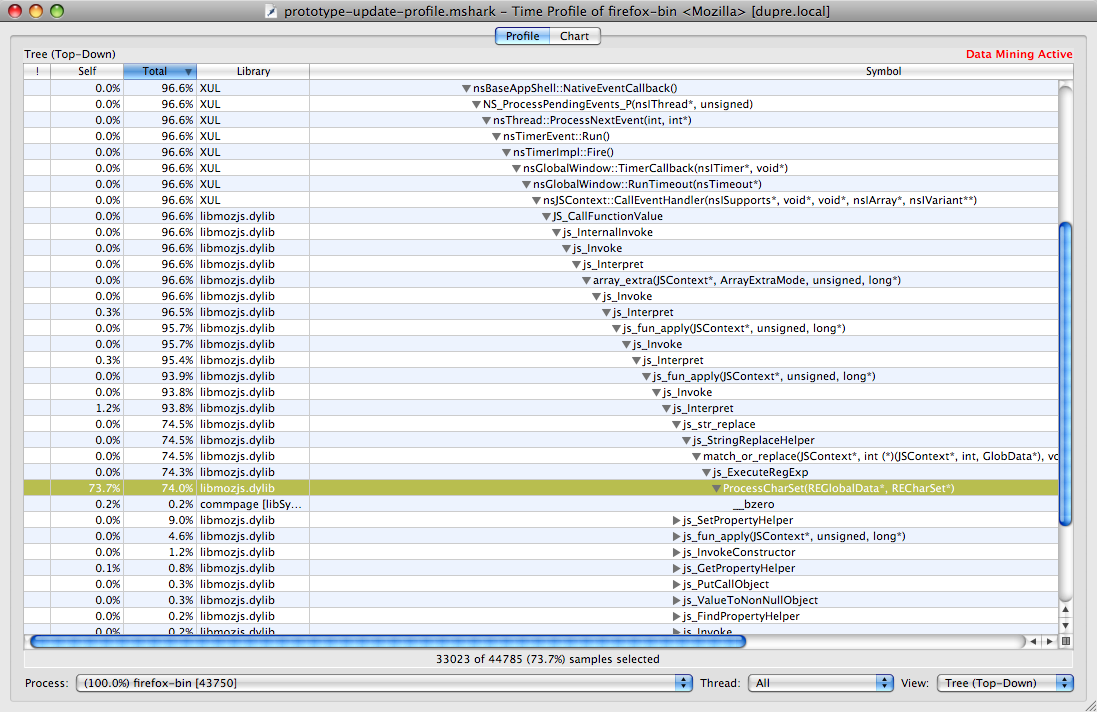
- By using the top-down view, I quickly discovered that over 70% of runtime was spent in a single function:

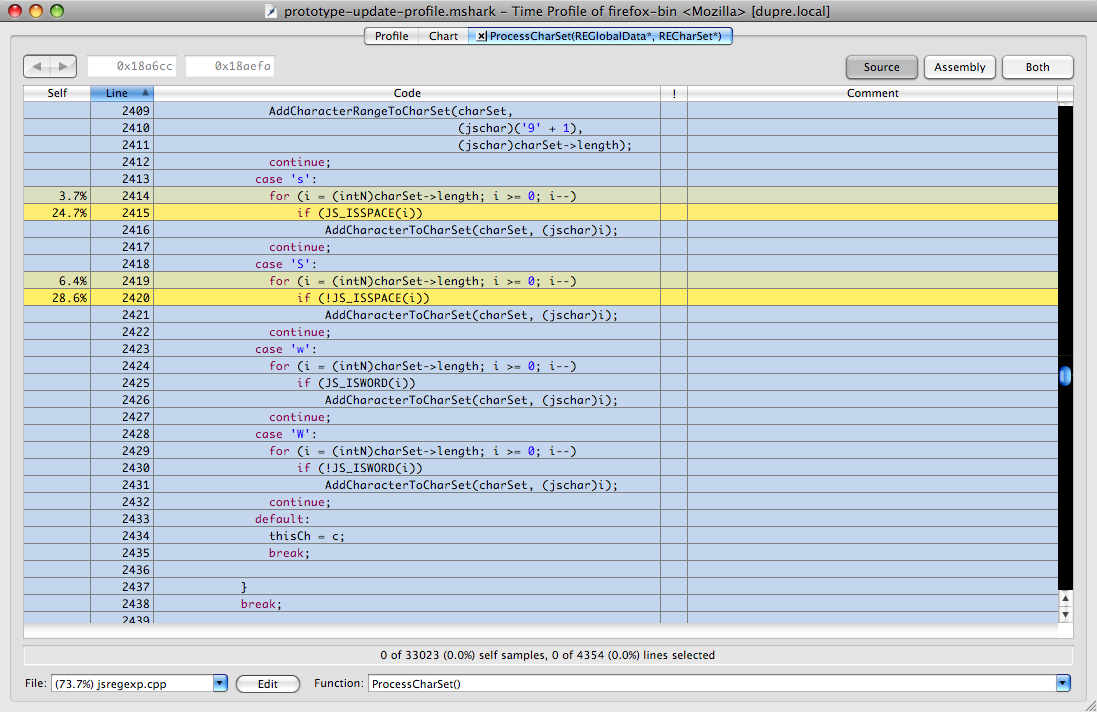
- By double-clicking this function, I could see a heatmap of execution within the function: just two lines of code were responsible for most of the time!:
 .
.
- This was more than enough evidence to file a bug.
- After a bit of conversation with Brian Crower on IRC, I found that my initial hypothesis was wrong: The JS_ISSPACE
macro is not really to blame. Every time it encountered a \s or \S in a regular expression character class, the code would loop over all 65,536 characters in the unicode basic plane and ask a series of lookup tables “is this character a space?” Because there are a small number of actual whitespace characters, I could replace this large loop with a small table of whitespace character ranges. - The patch made this particular test 77% faster, from 850ms to 195ms.
I’ve already filed a bug on another test and will be working through at least four more significant slowdowns. Doing this profiling has been a lot of fun, and a nice change of pace from the garbage collection slog. I really encourage anyone who has a mac to spend a little time with Shark and a performance issue: it actually makes visualizing and analyzing performance problems fun.

October 10th, 2008 at 9:11 am
Took me a little bit of digging to find this but I thought I’d mention it. The value of the shark parameter in the url is a regular expression that should match the subtest that you are trying to profile. If it matches multiple tests then you’ll get a profile for each. Usually you can just put in a good substring of the test name, but watch out to escape “+” and the like.
March 22nd, 2010 at 11:46 am
[…] took a look at his test case under Shark (Benjamin has a great post on how to use it) and noticed that we were spending 9.8% of our time in js_CoerceArrayToCanvasImageData. Reading […]