Graph of the Day: Empty Minidump Crashes Per User

Monday, April 22nd, 2013

Sometimes I make a graph to confirm a theory. Sometimes it doesn’t work. This is one of those days.

I created this graph in an attempt to analyze bug 837835. In that bug, we are investigating an increase in the number of crash reports we receive which have an empty (0-byte) minidump file. We’re pretty sure that this usually happens because of an out-of-memory condition (or an out of VM space condition).

Robert Kaiser reported in the bug that he suspected two date ranges of causing the number of empty dumps to increase. Those numbers were generated by counting crashes per build date. But they were very noisy, partly because they didn’t account for the differences in user population between nightly builds.

In this graph, I attempt to account for crashes per user. This was a slightly complicated task, because it assembles information from three separate inputs:

  • ADU (Active Daily Users) data is collected by Metrics. After normalizing the data, it is saved into the crash-stats raw_adu table.
  • Build data is pulled into the crash-stats database by using a tool called ftpscraper and saved into the releases_raw table. Anything called “scraper” is finicky and changes to other system can break it.
  • Crash data is collected directly in crash-stats and stored in the reports_clean table.

Unfortunately, each of these systems has their own way of representing build IDs, channel information, and operating systems:

Product

Build ID

Channel

OS

raw_adu

“Firefox”

string “yyyymmddhhmmss”

“nightly”

“Windows”

releases_raw

“firefox”

integer yyyymmddhhmmss

“Nightly”

“win32”

reports_clean

“Firefox” (from product_versions)

integer yyyymmddhhmmss

“Nightly” when selecting from reports_clean.release_channel, but “nightly” when selecting from reports.release_channel.

“Windows NT”, but only when a valid minidump is found: when there is an empty minidump, os_name is actually “Unknown”

In this case, I’m only interested in the Windows data, and we can safely assuming that almost all of the empty minidump crashes occur on Windows. The script/SQL query to collect the data simply limits each data source separately and then combines them after they have been limited to windows nightly builds, users, and crashes.

Frequency of Empty Dump crashes on Windows Nightlies

This missing builds are the result of ftpscraper failure.

I’m not sure what to make of this data. It seems likely that we may have fixed part of the problem in the 2013-01-25-03-10-18 nightly. But I don’t see a distinct regression range within this time frame. Perhaps around 25-December? Of course, it could also be that the dataset is so noisy that we can’t draw any useful conclusions from it.

Graph of the Day: Crash Report Metadata

Friday, April 12th, 2013

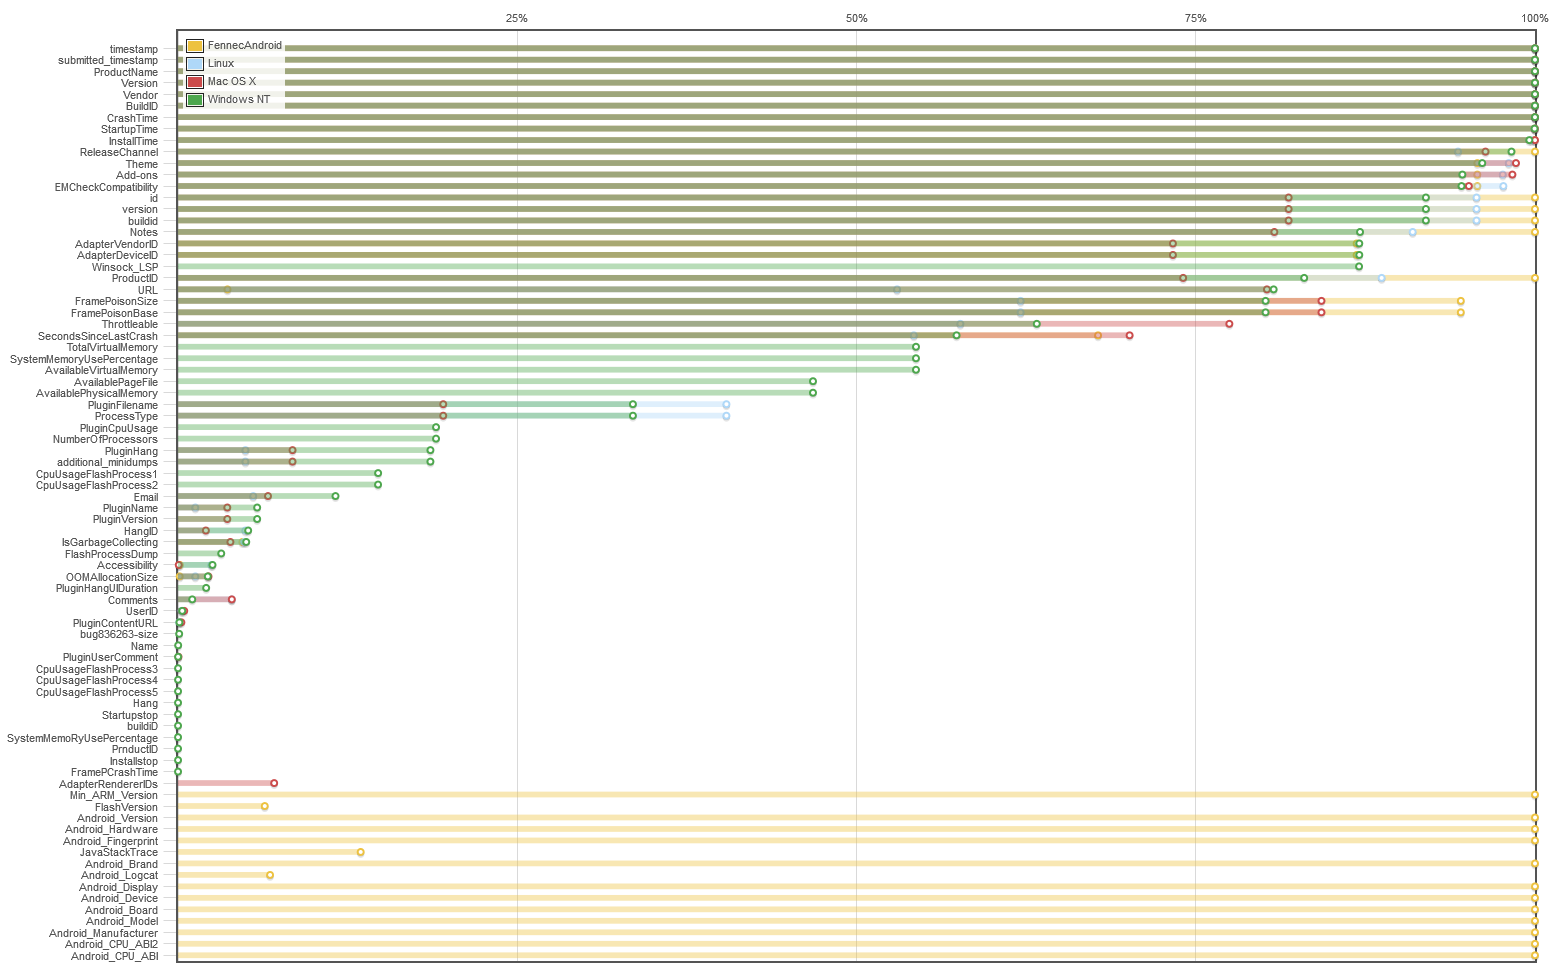
When Firefox crashes, it submits a minidump of the crash; it also submits some key/value metadata. The metadata includes basic information about the product/version/buildid, but it also includes a bunch of other information that we use to group, correlate, and diagnose crashes. Using data collected with jydoop, I created a graph of how frequently various metadata keys were submitted on various platforms:

Frequency of Crash Report Metadata on 2-April-2013

The jydoop script to collect this data is simple:

import crashstatsutils
import json
import jydoop

setupjob = crashstatsutils.dosetupjob([('meta_data', 'json'), ('processed_data', 'json')])

def map(k, meta_data, processed_data, context):
    if processed_data is None:
        return

    try:
        meta = json.loads(meta_data)
        processed = json.loads(processed_data)
    except:
        context.write('jsonerror', 1)
        return

    product = meta['ProductName']

    os = processed.get('os_name', None)
    if os is None:
        return

    context.write((product, os, '$total'), 1)
    for key in meta:
        context.write((product, os, key), 1)

combine = jydoop.sumreducer
reduce = jydoop.sumreducer

View the raw data (CSV).

If you are interested in learning what each piece of metadata means and is used for, I’ve started to document them on the Mozilla docs site.

This graph was generated using the flot JS library and the code is available on github.

Graph of the Day: Firefox Virtual Memory Plot

Thursday, April 11th, 2013

I spend a lot of time making sense out of data, and so I’m going to try a new “Graph of the Day” series on this blog.

Today’s plot was created from a crash report submitted by a Firefox user and filed in bugzilla. This user had been experiencing problems where Firefox would, after some time, start drawing black boxes instead of normal content and soon after would crash. Most of the time, his crash report would contain an empty (0-byte) minidump file. In our experience, 0-byte minidumps are usually caused by low-memory conditions causing crashes. But the statistics metadata reported along with the crash show that there was lots of available memory on the system.

This piqued my interest, and fortunately, at least one of the crash reports did contain a valid minidump. Not only did this point us to a Firefox bug where we are aborting when large allocations fail, but it also gave me information about the virtual memory space of the process when it crashed.

When creating a Windows minidump, Firefox calls the MinidumpWriteDump function with the MiniDumpWithFullMemoryInfo flag. This causes the minidump to contain a MINIDUMP_MEMORY_INFO_LIST block, which includes information about every single block of memory pages in the process, the allocation base/size, the free/reserved/committed state, whether the page is private (allocated) memory or some kind of mapped/shared memory, and whether the page is readable/writable/copy-on-write/executable.

(view the plot in a new window).

There are two interesting things that I learned while creating this plot and sharing it on mozilla.dev.platform:

Virtual Memory Fragmentation

Some code is fragmenting the page space with one-page allocations. On Windows, a page is a 4k block, but page space is not allocated in one-page chunks. Instead, the minimum allocation block is 16 pages (64k). So if any code is calling VirtualAlloc with just 4k, it is wasting 16 pages of memory space. Note that this doesn’t waste memory, it only wastes VM space, so it won’t show up on any traditional metrics such as “private bytes”.

Leaking Memory Mappings

Something is leaking memory mappings. Looking at the high end of memory space (bottom of the graphical plot), hover over the large blocks of purple (committed) memory and note that there are many allocations that are roughly identical:

  • Size: 0x880000
  • State: MEM_COMMIT
  • Protection: PAGE_READWRITE PAGE_WRITECOMBINE
  • Type: MEM_MAPPED

Given the other memory statistics from the crash report, it appears that these blocks are actually all mapping the same file or piece of shared memory. And it seems likely that there is a bug somewhere in code which is mapping the same memory repeatedly (with MapViewOfFile) and forgetting to call UnmapViewOfFile when it is done.

Conclusion

We’re still working on diagnosing this problem. The user who originally reported this issue notes that if he switches his laptop to use his integrated graphics card instead of his nvidia graphics, then the problem disappears. So we suspect something in the graphics subsystem, but we’re not sure whether the problem is in Firefox accelerated drawing code, the Windows D3D libraries, or in the nvidia driver itself. We are looking at the possibility of hooking allocations functions such as VirtualAlloc and MapViewOfFile in order to find the call stack at the point of allocation to help determine exactly what code is responsible. If you have any tips or want to follow along, see bug 859955.

Adobe Symbol Server: How Adobe Could Address Crash Issues

Thursday, February 18th, 2010

Since crash bugs are a top priority within Adobe, there is one relatively simple step Adobe should take which would make it much easier for everyone else to help Adobe track and diagnose crashes: implement a symbol server.

A symbol server is a public web server from which developers can fetch debugging information (PDB files) for released binaries. The Microsoft debuggers have excellent support for automatically pulling down symbols as they are needed in the debugger. Mozilla runs a symbol server for Firefox nightlies and releases, which is invaluable for people debugging and profiling Firefox without having to do a custom build. Microsoft runs a symbol server which contains debug information for Windows and many other Microsoft products, including the Silverlight plugin.

Debug information is not simply a way to get symbolic information from Flash. It is necessary in order to get any useful stack trace of the Mozilla code which is calling Flash. A common compiler optimization called frame pointer omission (FPO) avoids storing the frame pointer in the x86 EBP register, freeing that register up for general use. In order to walk the stack of this optimized code, the debugger has to query the frame size and frame pointer information from the PDB file. When debug information is not available, stack walking doesn’t produce usable results.

As an example, take the current #3 topcrash for nightly builds of Firefox (mozilla-central). The signature for this crash is NPSWF32.dll@0x1e7fe4. The stack traces from Mozilla’s crash reporting system are completely opaque:

Frame

Signature

0

NPSWF32.dll@0x1e7fe4

1

NPSWF32.dll@0x1ff471

2

NPSWF32.dll@0x2005bd

3

NPSWF32.dll@0x1fb195

4

NPSWF32.dll@0x1e02d1

5

NPSWF32.dll@0x17c22a

6

NPSWF32.dll@0x2959d

7

NPSWF32.dll@0x30386

8

@0x63aa15f

9

NPSWF32.dll@0x5bdef

Even worse, the crash signature depends on the particular version of Flash that is installed on the user’s computer. We can’t tell if a particular crash signature is fixed by a new revision of flash because without symbols we can’t correlate crashes between different versions.

As part of developing multi-process plugins for Firefox, we are constantly dealing with unexpected plugin behaviors. Whenever we encounter a problem which can be reproduced in both Silverlight and Flash, we’ll always test with silverlight, simply because Microsoft makes Silverlight symbols available through their symbol server and therefore we can actually step through their code and ours in a debugger.

Adobe should set up a symbol server for their three main plugins, Flash, Shockwave, and Acrobat. By implementing this simple tool, Adobe could help all browser vendors and interested hackers to help identify and fix bugs. If Adobe is concerned about using full debug information to reverse-engineer details of their code, there is a way to strip the PDB files so that only frame-pointer information and function names.